Debugging Your Mods
The microsoft documentation says:
When you debug your app, it usually means that you are running your application with the debugger attached. When you do this, the debugger provides many ways to see what your code is doing while it runs. You can step through your code and look at the values stored in variables, you can set watches on variables to see when values change, you can examine the execution path of your code, see whether a branch of code is running, and so on. If this is the first time that you've tried to debug code, you might want to read Debugging for absolute beginners before going through this guide.
General Setup
- Install BepInEx from thunderstore
- On your selected profile for R2ModMan/Thunderstore, go to
Settings, - In the
Settingstab, click the option with the nameBrowse profile folder -
Open the
doorstop_config.inifound You can set the config like thisThis will make doorstop suspend the game on start, open a debugging server at port 55555, allowing you to attach any debugger of your liking, you can use either VS, dnSpy or Rider.# If true, Mono debugger server will be enabled debug_enabled=true # When debug_enabled is true, specifies the address to use for the debugger server debug_address=127.0.0.1:55555 # If true and debug_enabled is true, Mono debugger server will suspend the game execution until a debugger is attached debug_suspend=true -
Don't forget to put the .pdb file next to your plugin .dll, that's the file which contains the debug data
Putting breakpoints inside game assemblies while using the Visual Studio Debugger is not possible currently, but works with dnSpy, please refer to the dnSpy section below on how to configure it.
Visual Studio 2022
- Install Visual Studio Tools for Unity
- Install UnityModExtension
- Configure the Unity Mod Extension if needed by going in Tools -> Options

- Press Debug -> Run Game and Start Debugging

- If you want to attach to a currently running game instance or that the extension is not working, Press Debug -> Attach Unity Debugger -> Input IP -> Type
127.0.0.1:55555(Make sure VSTU dropdown option is selected) -> OK
dnSpy
Make sure the doorstop_config.ini is setup like above, but with the debug_suspend=false, since having it as true doesn't seem to work with dnSpy
You'll need to setup the BepInEx.cfg so that it dumps game assemblies to folder, as there may be BepInEx patchers modifying the game assemblies.
In the BepInEx/config/BepInEx.cfg, set to true the following entries: DumpAssemblies, LoadDumpedAssemblies and BreakBeforeLoadAssemblies.
In dnSpy, make sure that the RoR2.dll that is in there is the assembly from BepInEx\DumpedAssemblies\Risk of Rain 2\RoR2.dll
Then, launch the game, attach with dnSpy through Debug -> Start Debugging -> Debug Engine: Unity (connect)
It should automatically breakpoint somewhere inside a BepInEx assembly, then you'll be able to put any breakpoint in the game assemblies
Rider
This optional section guides you through integrating the build->run->debug process into a single-click process using the Rider IDE. Visit the end of the section to see results.
Building with Rider
In this step, we are going to tell Rider to automatically copy our plugin build to our desired location after our build completes.
-
Get absolute path of your desired output location:
-
For r2modman profiles (recommended), it should look something like
C:\Users\YOUR_USER_NAME\AppData\Roaming\r2modmanPlus-local\RiskOfRain2\profiles\YOUR_PROFILE_NAME\BepInEx\plugins\YOUR_PLUGIN_NAME -
If you are NOT using r2modman, your path should look something like this:
C:\Program Files (x86)\Steam\steamapps\common\Risk of Rain 2\BepInEx\plugins -
Open your
PROJECT.csprojand add the following to the file, replacing theOutDirattribute value with the path you retrieved in the previous step.
<Project> <!-- (Make sure you paste within the Project tag like i'm showing here. Don't include this line) -->
    <PropertyGroup Condition=" '$(Configuration)' == 'Debug' ">
      <OutDir>C:\Users\YOUR_USER_NAME\AppData\Roaming\r2modmanPlus-local\RiskOfRain2\profiles\dev\BepInEx\plugins\YOUR_PLUGIN_DIR_NAME</OutDir>
    </PropertyGroup>
</Project> <!-- (Make sure you paste within the Project tag like i'm showing here. Don't include this line) -->
We're all done with building! Feel free to give it a test by building your project and ensuring the build ends up in the right location.
Running with Rider
By the end of this section, you will be able to run Risk of Rain 2 using your r2modman profile (or your non-r2modman alternative) and freshly built plugin by clicking the Run and Debug buttons built-in to Rider.
-
Open Rider's run configuration editor (see photo):
-
For this next step, it is critical you have correctly completed the General Setup. Confirm this by launching your r2modman profile through r2modman. You'll know you're in the clear when your mods are loading without any issues.
-
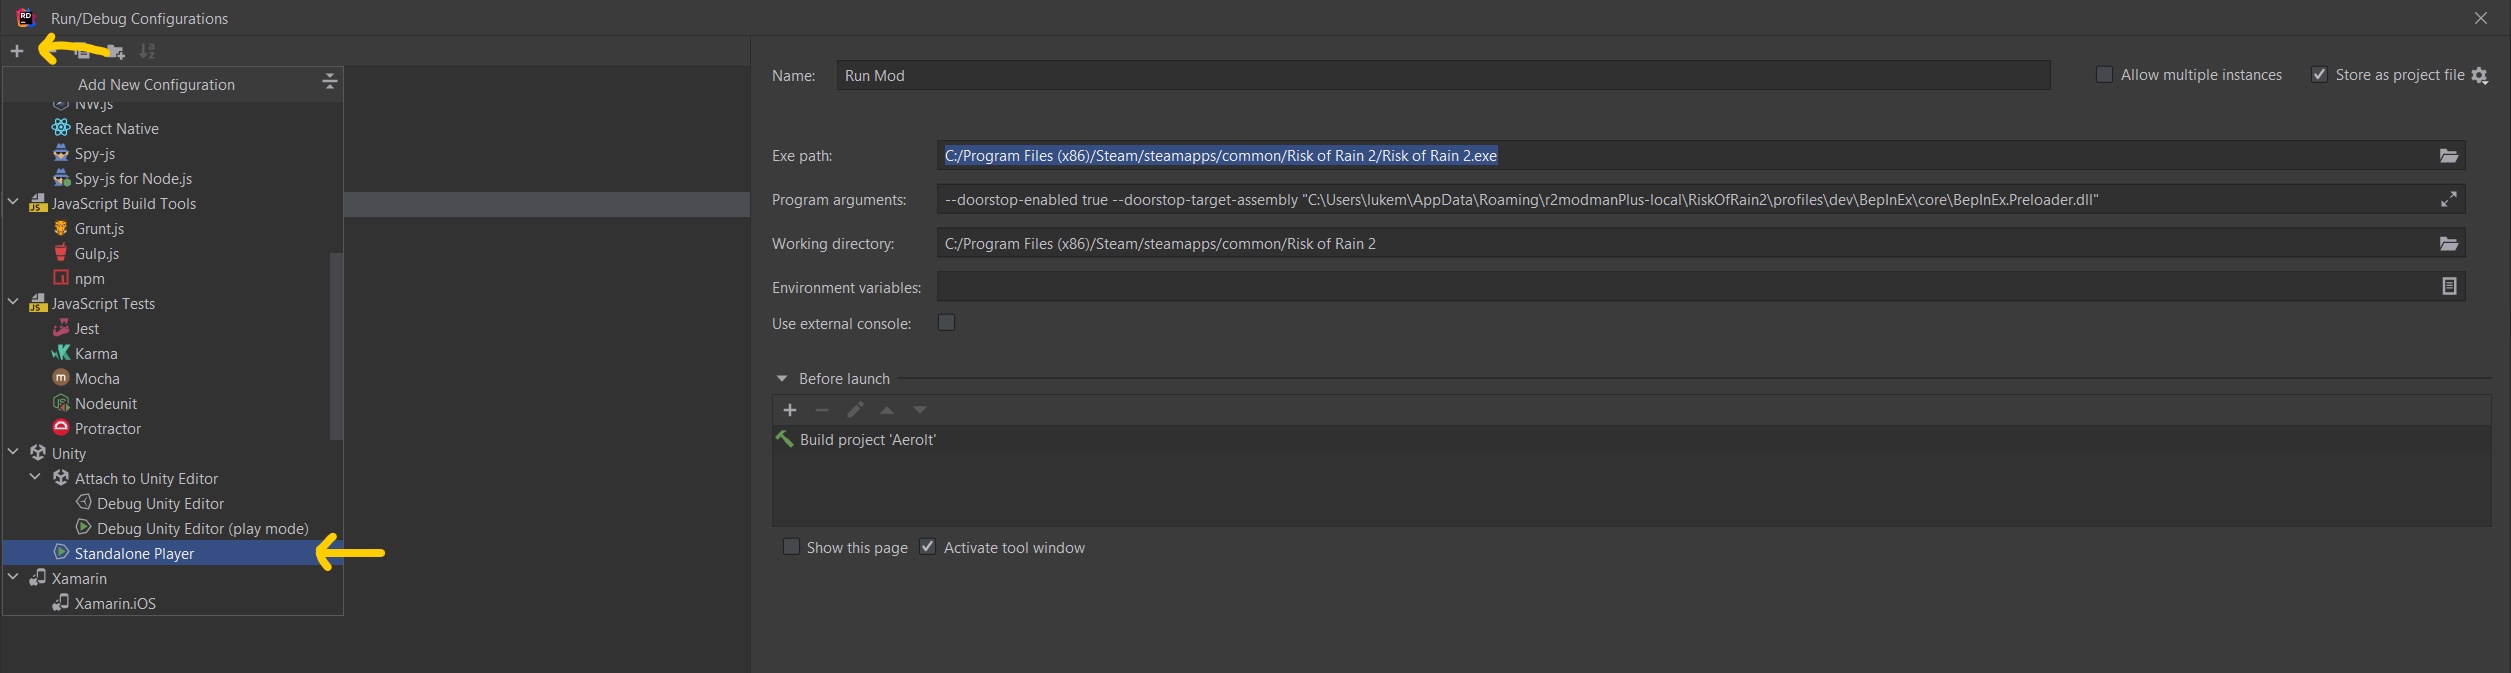
In this next photo, you're going to create a new Run/Debug configuration. Let's start with creating a standalone process for your game (Don't worry about the fields for it yet).
-
Now that you have a Standalone Player, let's get the fields filled out (Refer to photo below for reference through each step).
-
(Refer to the circle on the left) Select your newly created Standalone Player run configuration.
-
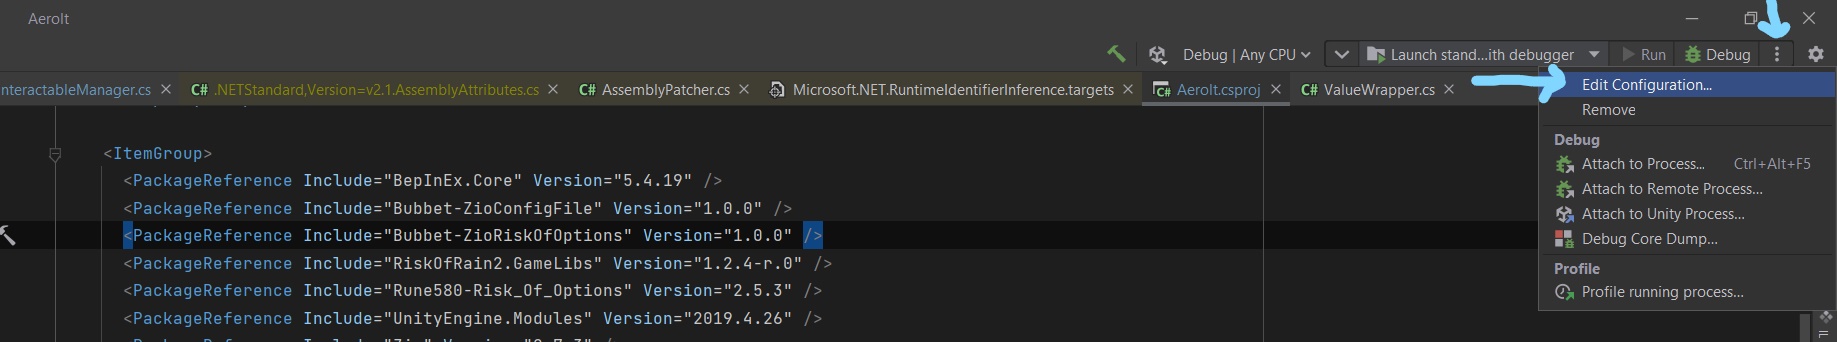
Click on the + symbol below the Before Launch section of the configuration options and select Build Project. You'll know it's correct when you see that green hammer like I have at the middle of the screen.
-
Set Exe path to
C:/Program Files (x86)/Steam/steamapps/common/Risk of Rain 2/Risk of Rain 2.exe(or, wherever your Risk of Rain 2.exe file is located). In case you're wondering, this is the same executable that r2modman profiles execute, so it won't be different regardless of using an r2modman profile or not. Once you select this, Working Directory will automatically populate. -
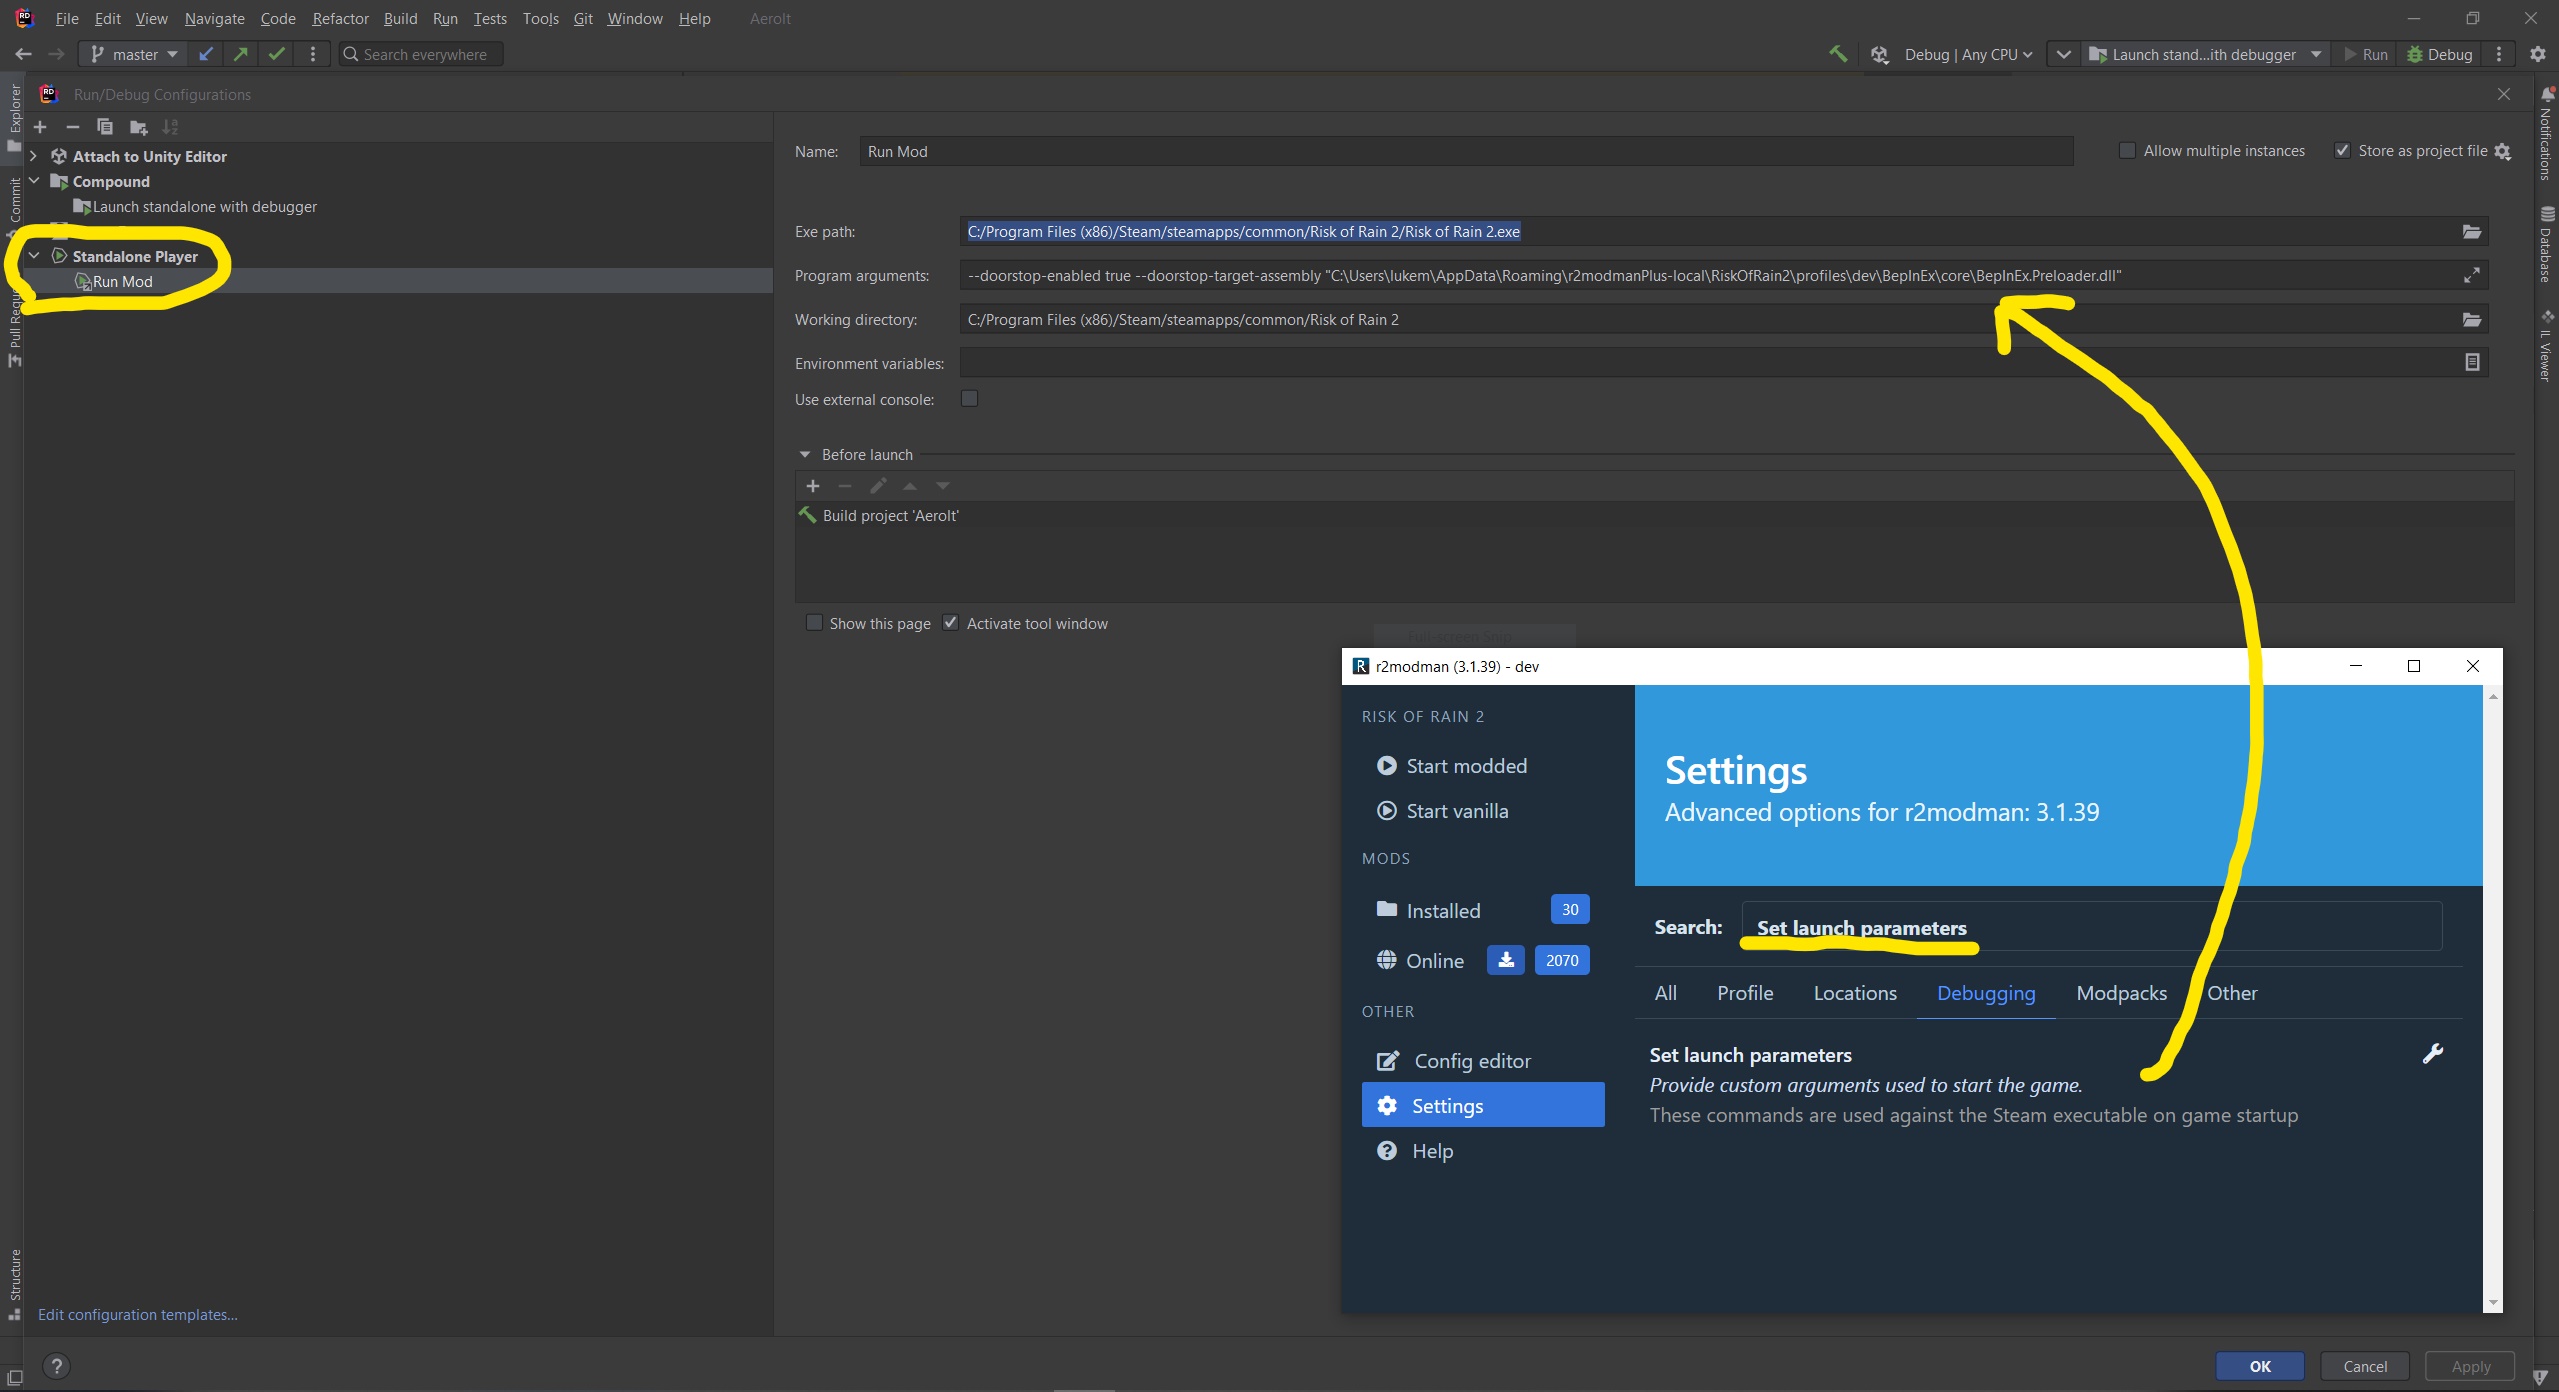
The last thing you need is Program arguments. It's important to note that incorrect arguments will result in your mods failing to load. Please reach out to the FAQ or Community discord with questions Here's how to get the info you need:
- r2modman profiles: Launch r2modman and select the profile you modified during the General Setup and Building with Rider section, navigate to settings, and search for Set launch parameters (see photo below). Click on the search result and you should see something like this:
Modded: --doorstop-enabled true --doorstop-target-assembly "C:\Users\YOUR_USER_NAME\AppData\Roaming\r2modmanPlus-local\RiskOfRain2\profiles\dev\BepInEx\core\BepInEx.Preloader.dll" Vanilla: doorstop-enabled false- Copy the text within the Modded category of your r2modman and paste that into the Program arguments, as shown in the picture below.
-
You now have Standalone Player properly configured. You'll know it works when clicking Rider's Run or Debug button against your Standalone Player configuration launches Risk of Rain directly using your r2modman profile. At this point, Rider is automatically building your mod, adding it to your custom r2modman profile, and launching for you.
Connecting to the debugger
By the end of this section, the debugger will be fully operational and seamlessly integrated with the previous sections.
-
Open Rider's configuration editor again. Create each of the following Run/Debug configurations:
-
Mono Remote -
Compound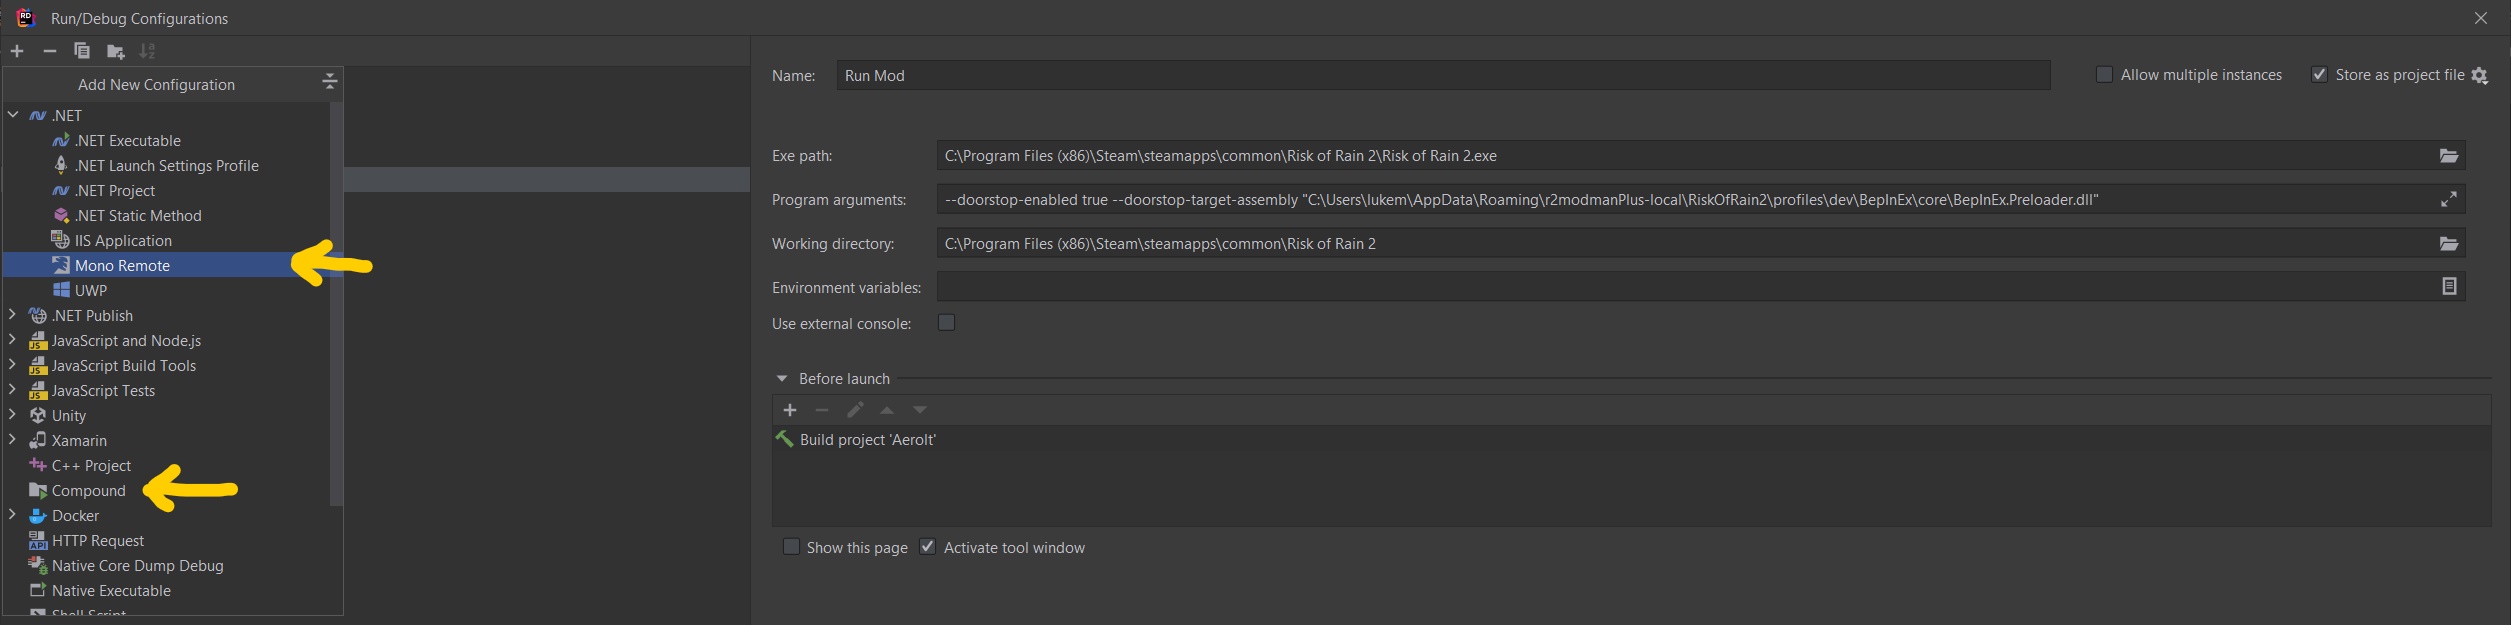
-
Select Mono Remote and configure as follows:
-
Host:
127.0.0.1 -
Port:
55555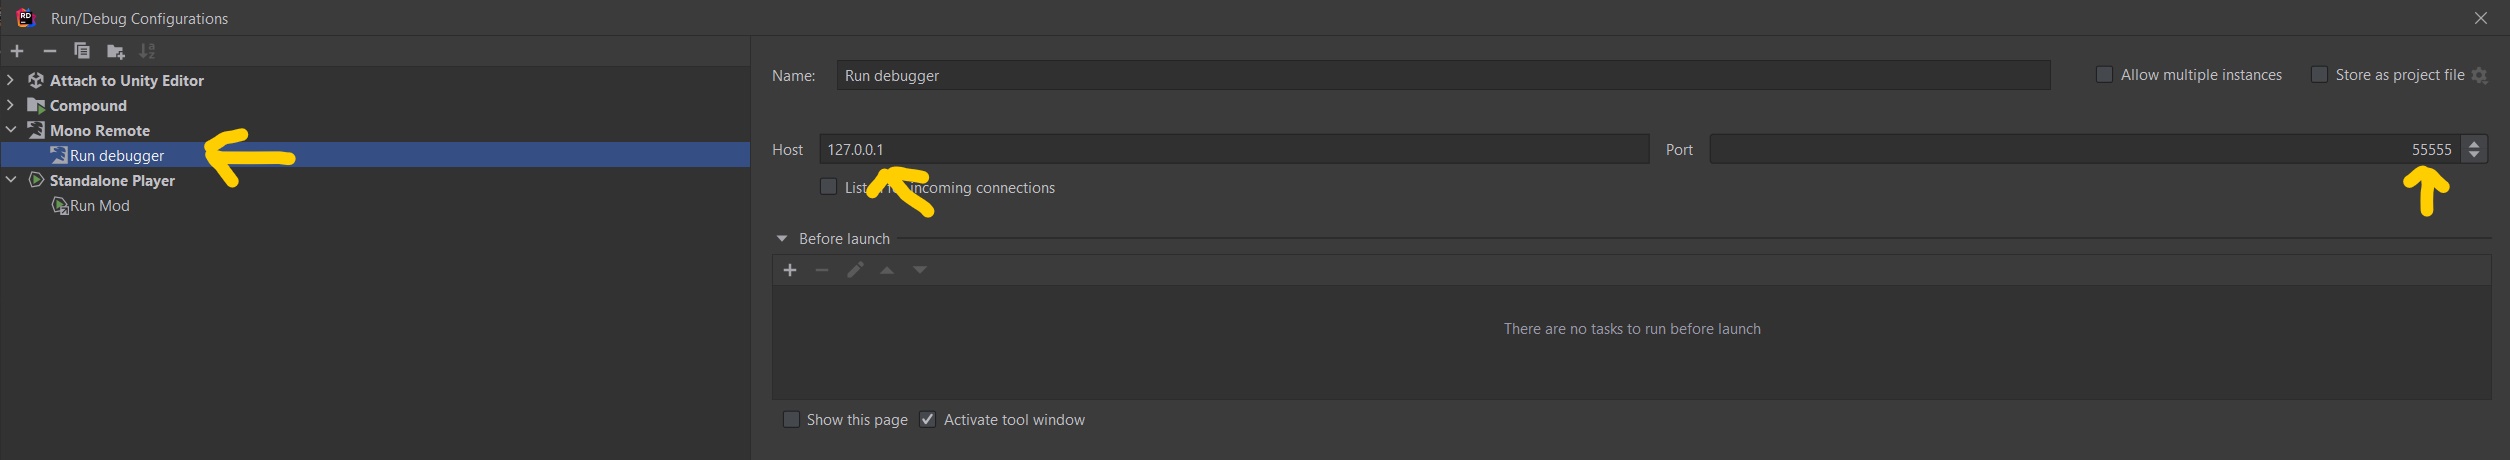
-
Select Compound and add the Mono debugger and Standalone player as shown in the photo below:
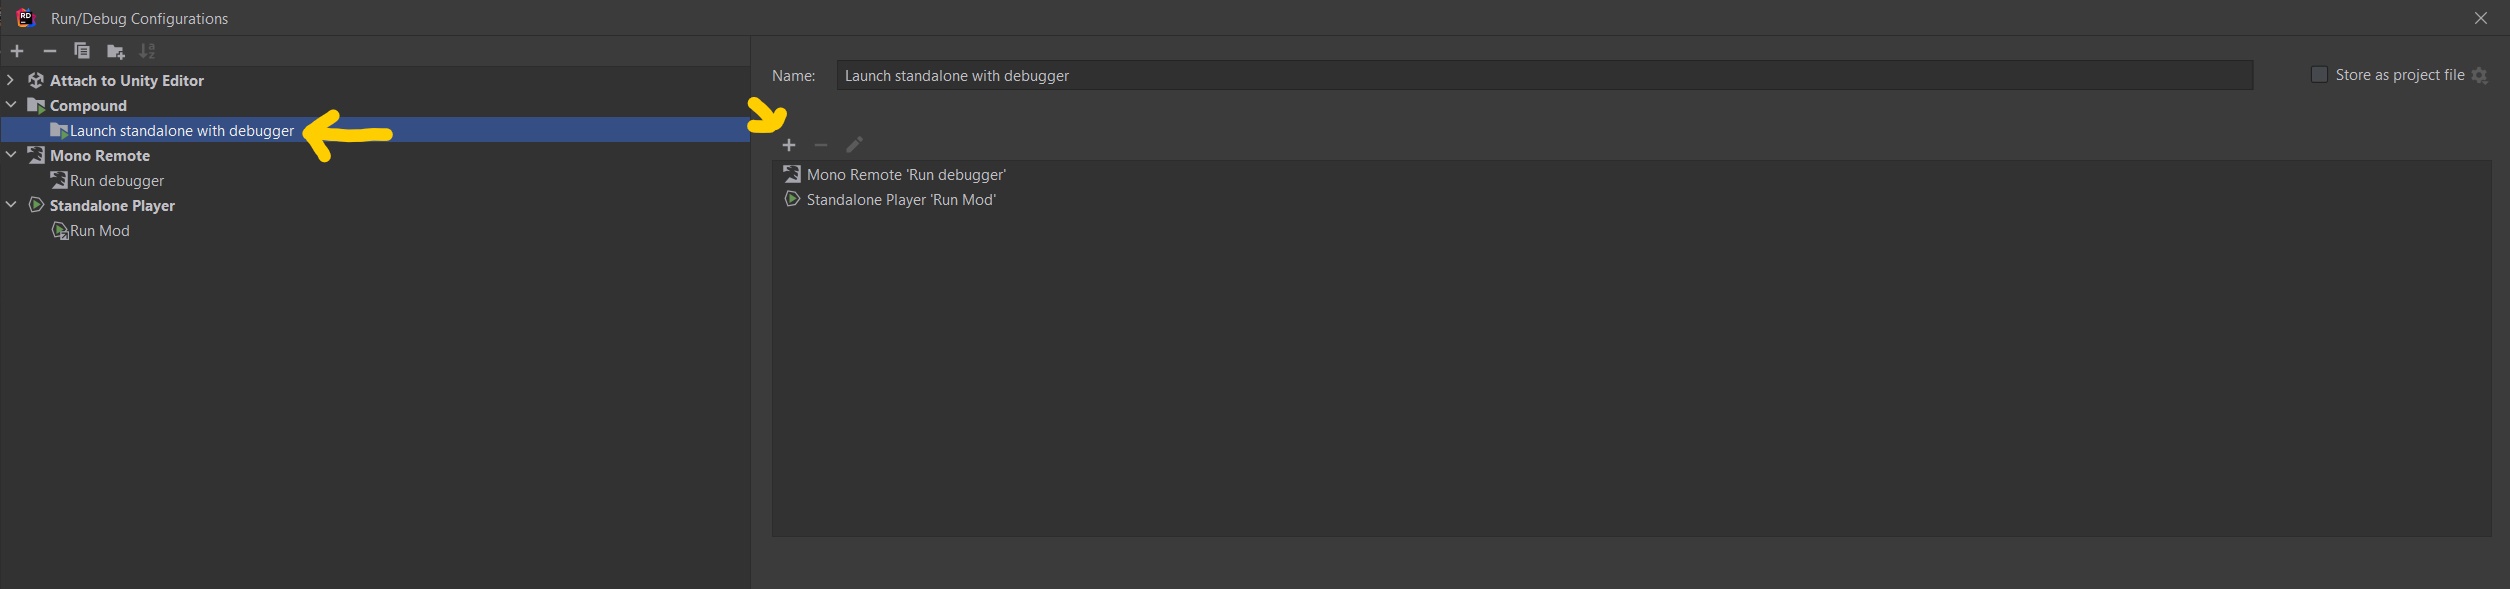
- Save and exit, select the Compound Run Configuration as the run/debug target as seen below:
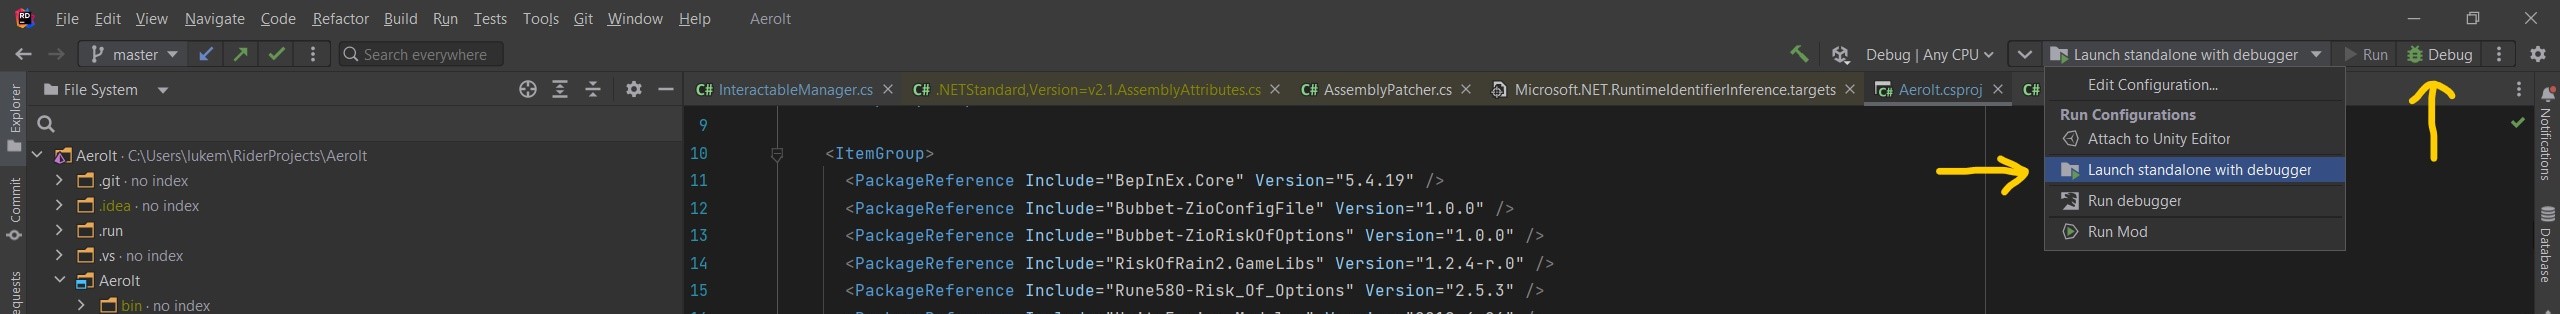
- Finally, make sure to select the Mono debug process (see arrow pointing to Run debugger below) to make use of the debugger as seen in the figure below, and set some breakpoints!!!
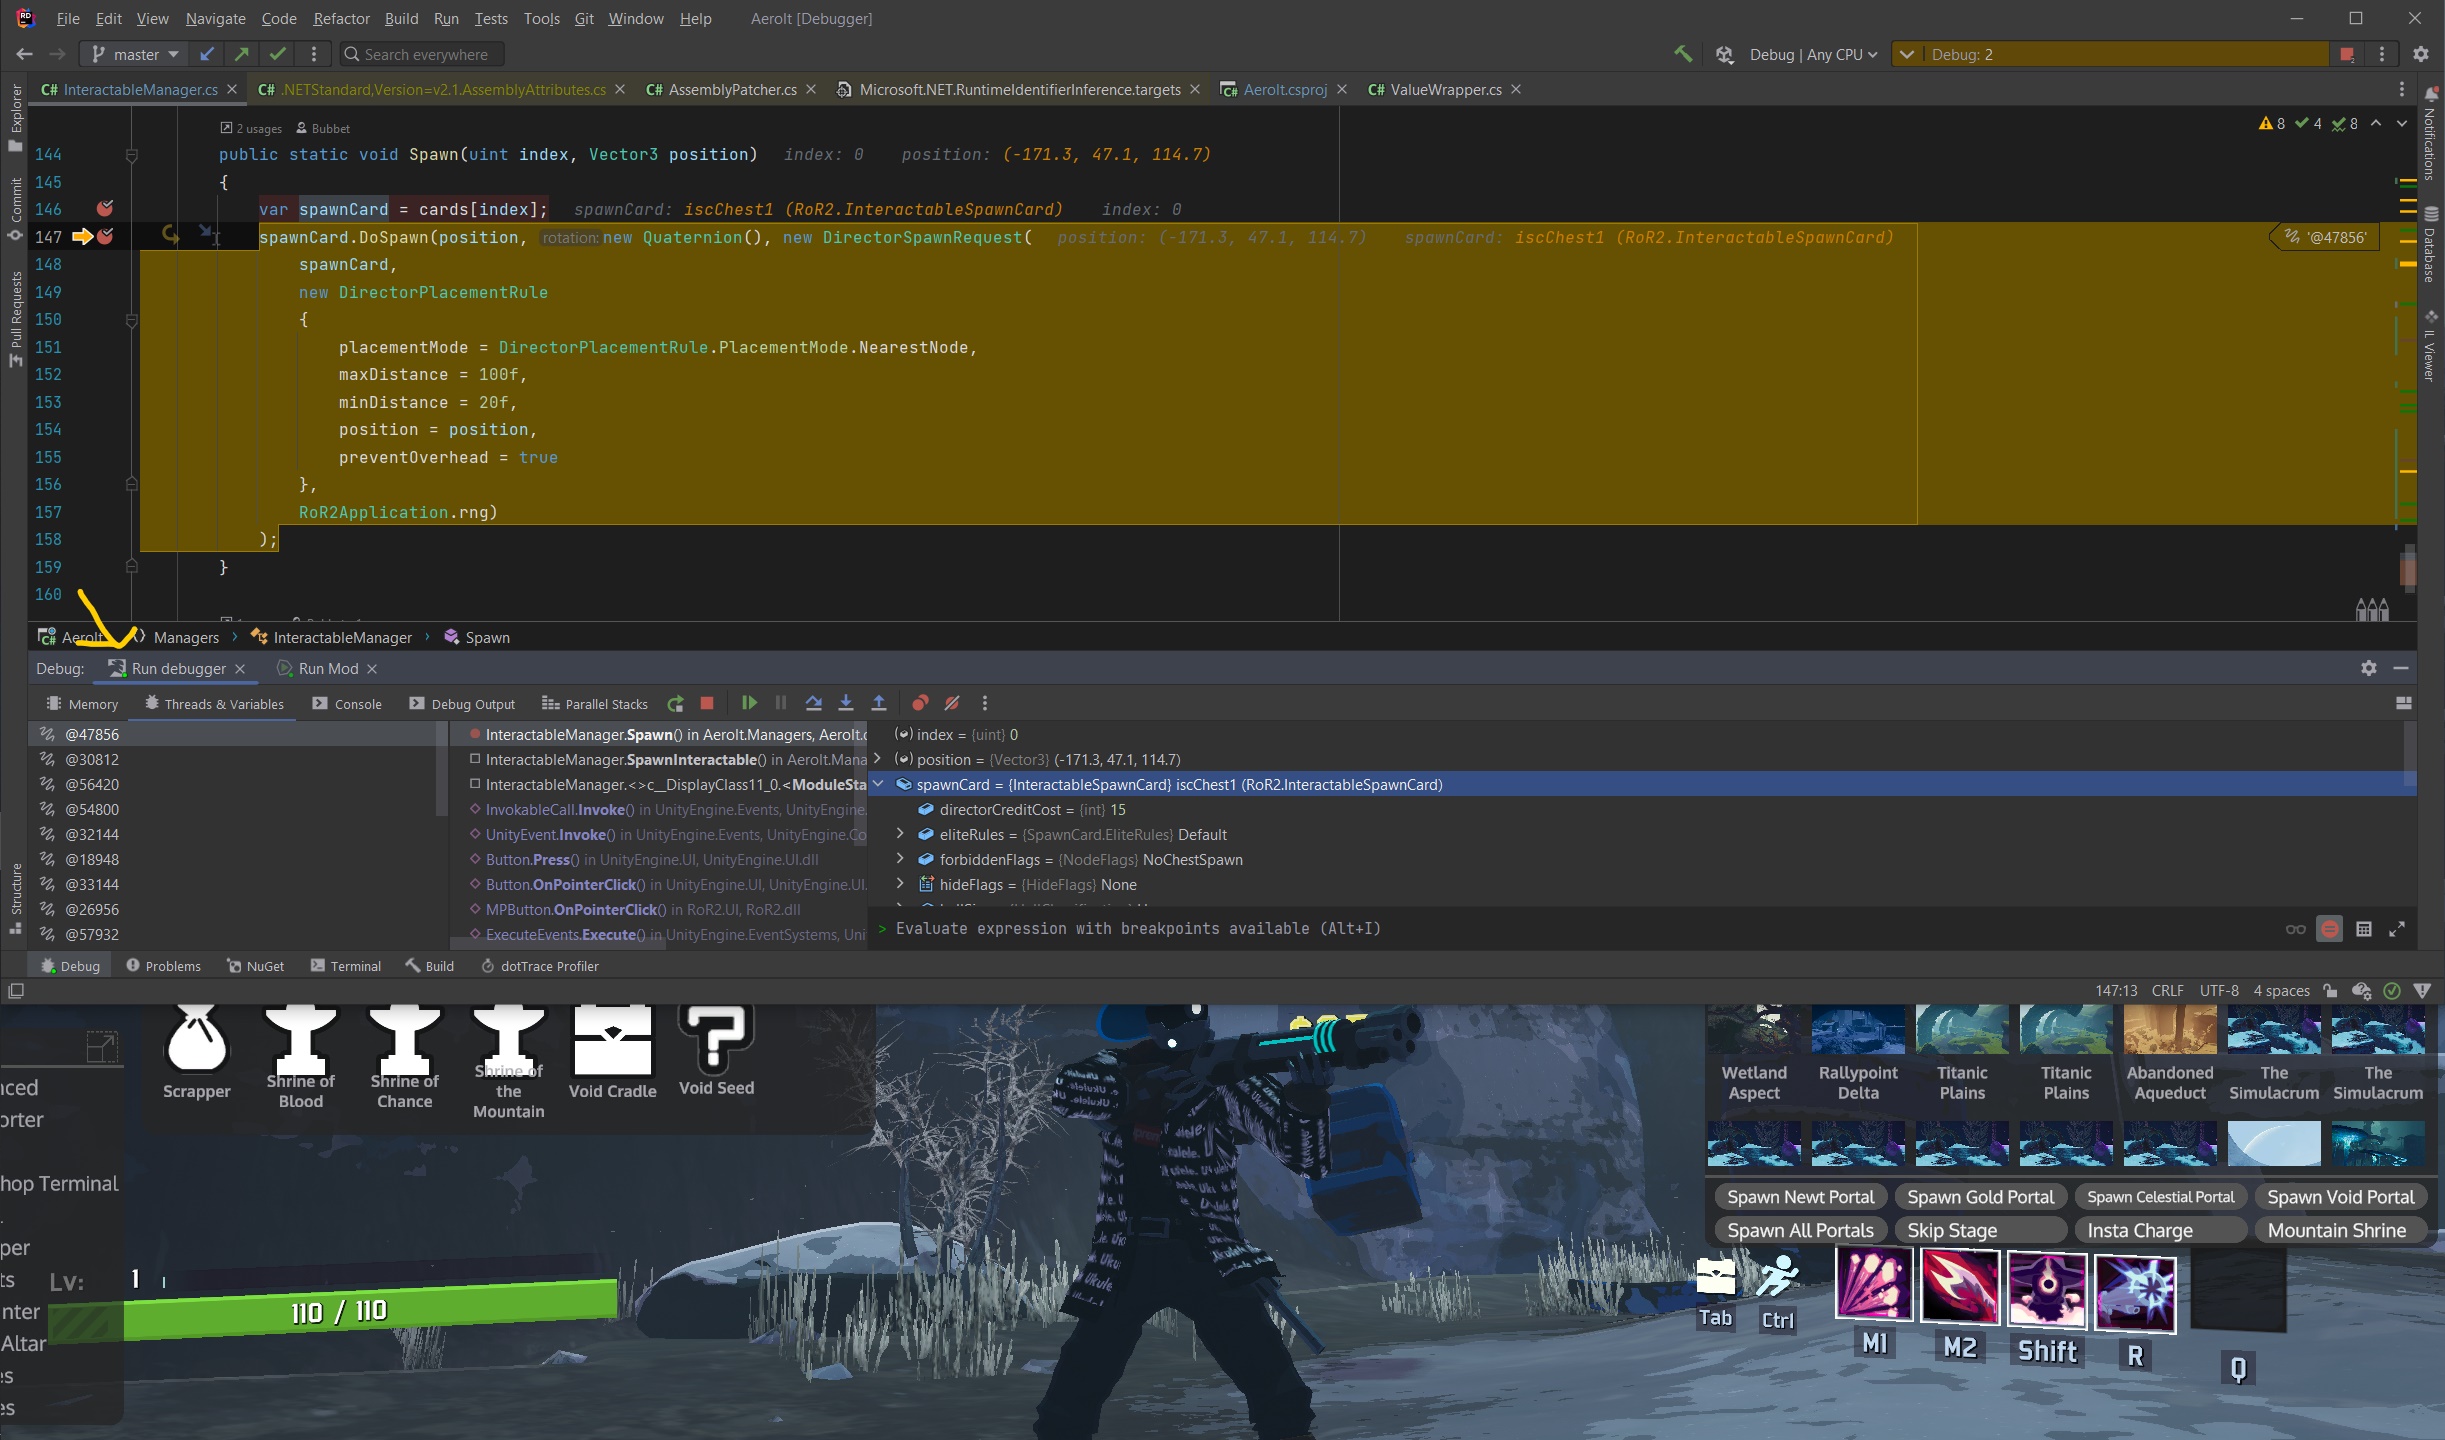
Congrats!! You are now a more productive engineer!
FAQ
-
Why aren't any mods loading after installing doorstop 4 into my r2modman profile directory?
-
This problem occurs with r2modman profiles, related to specific doorstop versions. Create a file in your r2modman's profile directory
C:\Users\YOUR_USER_NAME\AppData\Roaming\r2modmanPlus-local\RiskOfRain2\profiles\YOUR_PROFILE\and create a file named.doorstop_version. Open this file with any text editor and paste:4.0.0.0 -
This problem occurs when your BepInEx configuration files are misconfigured. Here's what you need:
-
From your profile directory, open the
BepInEx\config\BepInEx.cfgfile and update the following values if not updated already:-
[Logging.Console]: -
Enabled = true -
[Preloader.Entrypoint]: -
Assembly = RoR2.dll -
Type = FlashWindow
-
-
Now we're going to disable BepInEx's custom GUI since it isn't working properly with doorstop (we're switching to a normal terminal now). From the profile directory, open the
BepInEx\config\BepInEx.cfgfile and update the following:-
[Settings] -
Enable BepInEx GUI = false
-
-
Do a
Ctrl+Ffor the termlaunch parameters. If you used this value anywhere while following the tutorials, it may need updating.
-